Fuente: Harvard Law School Forum on Corporate Governance and Financial Regulation – Posted by Kosmas Papadopoulos, ISS Analytics (Monday, May 6, 2019)
In recent years, non-executive director compensation has received attention in the U.S. Increased board workloads, shifts in director compensation structure (away from meeting fees and towards slightly larger base retainers, for instance), a few instances of shareholder litigation in relation to excessive director pay, and a few voluntary submissions of management proposals asking for shareholder approval of their non-employee director compensation programs have all contributed to the activity.
Upon review of current trends in director pay, we observe a reasonable increase in total director compensation, across all market segments, and we continue to see differentiation by industry group. Although director pay increases have outpaced rank-and-file employee increases (but sharply trail increases to CEO pay), outside evidence suggests that increasing commitment by directors to their oversight roles, along with increasing investor expectations and in some industries regulatory demands, justify the increases in compensation.
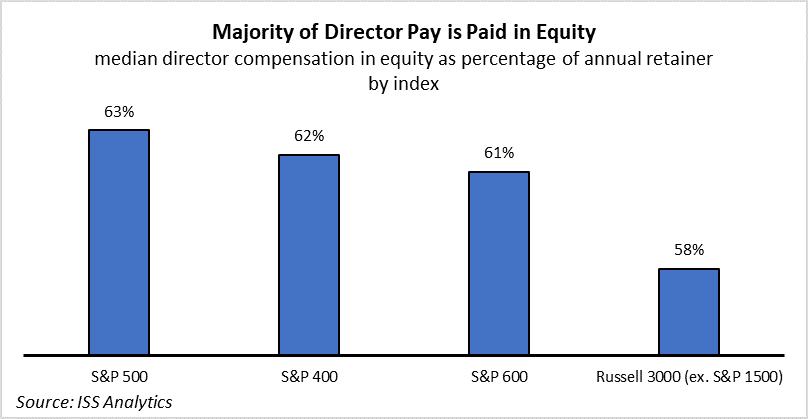
EEquity remains a significant component in total director pay, with most directors receiving more than 60 percent of their compensation in stock. Not surprisingly, we observe a correlation between non-executive director pay and CEO pay, as both figures are largely determined by company size.
Director Pay Levels
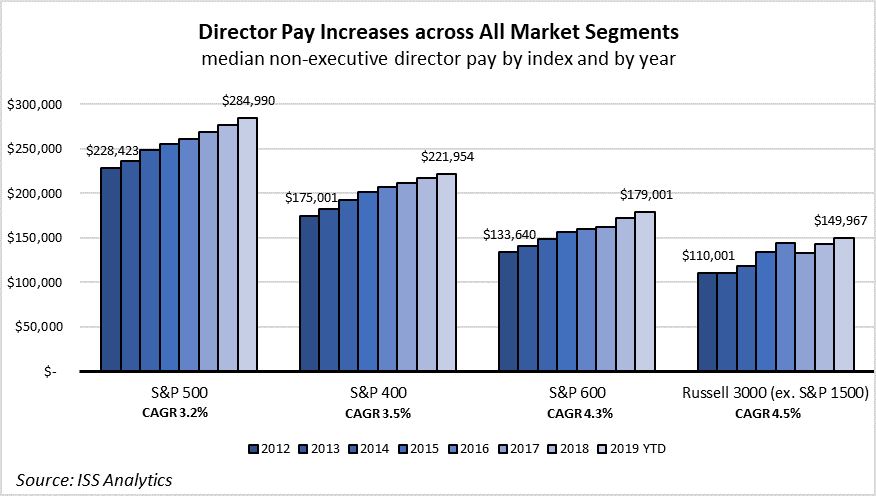
Director compensation correlates with company size, as larger companies generally pay higher director fees. At approximately $285,000, the median total annual director compensation of S&P 500 companies is 63 percent higher than the median total director pay for the rest of the Russell 3000.
Based on 2019 meeting data, median director compensation for all Russell 3000 companies increased by 2.7 percent compared to last year from approximately $193,000 to $198,000. Smaller companies (Russell 3000 constituents outside the S&P 1500) saw the highest rate of increase in median pay at 5.2 percent compared to last year, while the change in median non-executive director pay in the S&P 500 stood at 2.9 percent. The compound annual growth rate of director compensation during the past seven years ranges from 3.2 percent for the S&P 500 to 4.5 percent for Russell 3000 non-S&P 1500 companies. This rate of increase appears reasonable to most investors, especially given the increased demands placed on boards and directors in recent years.
Director Pay by Industry Group
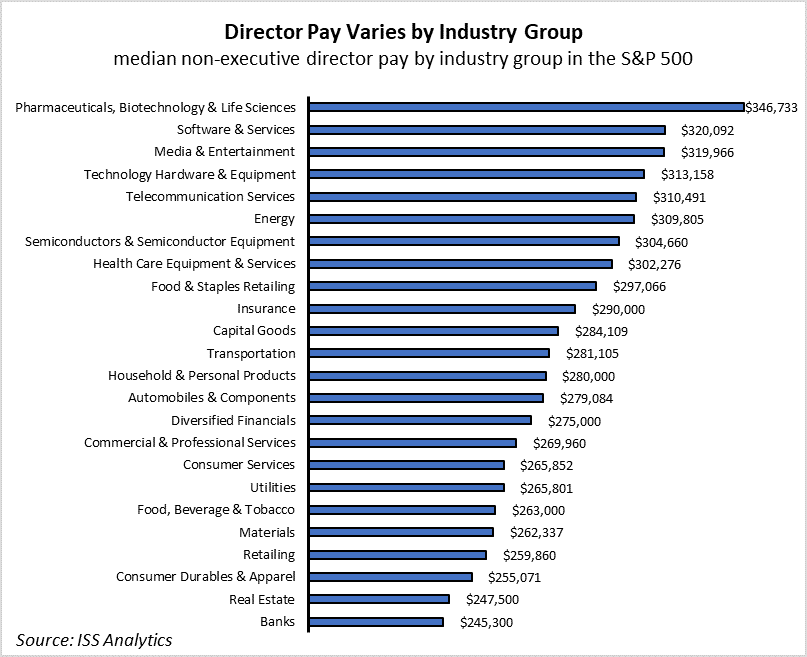
Director compensation also varies based on the company’s industry group. Among S&P 500 companies, pharmaceutical and biotechnology firms offer the highest director pay packages with a median pay figure of approximately $347,000. Technology firms, median companies, and energy firms are among the top paying industries with median director pay figures above $300,000. The higher director pay figures for these industries may be due to the specialized skills and expertise that are associated with these businesses. Retailing, consumer durables and apparel, real estate, and banks rank at the bottom of list; however, even for these industry groups, median director pay levels stand well above $240,000.
Director Equity Compensation
Director equity ownership is meant to encourage alignment with shareholder interest. Companies appear to subscribe to this idea, as a significant portion of director compensation is paid in equity across all size segments of the U.S. market. Russell 3000 companies pay approximately 60 percent of total director compensation in equity. Larger companies are slightly more likely to pay directors in stock.
To support the alignment of director’s interests with those of shareholders through equity ownership, many companies have adopted director ownership guidelines. As shown in the graph below, director ownership guidelines have become standard practice at large firms, while disclosure remains thin among smaller companies.
Director Pay and CEO Pay
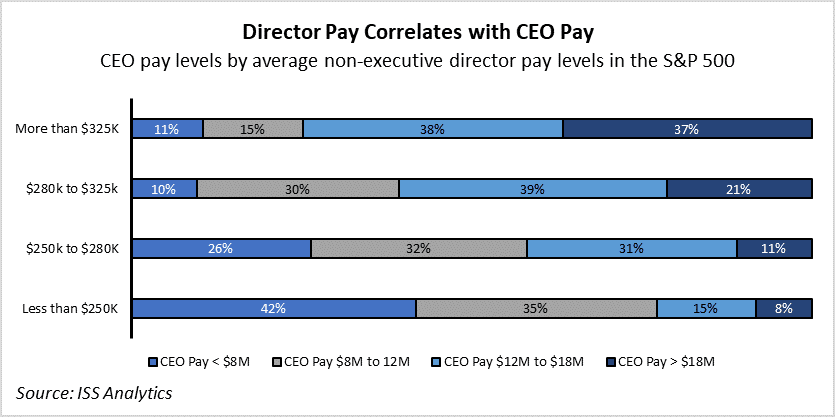
As expected, director pay levels generally correlate with CEO pay, since both figures are typically determined by the size and complexity of the company. The chart below shows the correlation between non-executive director pay and CEO pay among S&P 500 companies.


